


Is the London job market fair? It’s a simple question. But deceptively challenging to answer. What is fair? And for whom?
Fairness can take many forms. People with the same role, performing to the same standard, being paid equally. Or having access to equal opportunities. And being differentiated based on what matters for success, not something.
While not addressing differences between people in the same role, the recent UK gender pay gap reporting demonstrated women were under-represented in high paying jobs. Would the 2011 census data for London support this conclusion, and are there similar inequalities between ethnic groups?
In short, yes and yes. By looking at educational qualifications and workforce participation, the analysis demonstrated that in London:
- Despite similar educational qualifications across generations, men were 82% more likely to hold a management position than women.
- Women are far less likely to be in full-time employment (74% of men were in full-time jobs, while only 59% of women were).
- Almost twice as many women were in part-time employment.
- Women were 11 times more likely than men to be responsible for looking after the home or family.
- White people were 34% more likely to be in a management position than someone of mixed race, and 93% more likely than black people.
- Across all ethnicities, women were less likely to hold a management position, with the most substantial gaps between the genders being in Asian and Other ethnic groups.
- Despite white people being the most likely group to hold no educational qualifications.
- People of mixed and ‘other’ ethnicities were just over twice as likely to be unemployed.
- And black people were almost three times as likely to be unemployed.
Admittedly the analysis is limited and does not cover the quality of the work, what it is paid and any gaps between the same role. It also raises a lot of questions that could not be answered by the census data.
Nevertheless, by looking at a few key metrics, it does show distinct inequalities between genders and ethnicities in London.
UK Gender Pay Gap Reporting
The recent UK gender pay gap reporting attempted to answer the question of whether pay is fair between the genders. Overwhelmingly it showed that it is not. In the UK, women are far more likely to work for an employer where, overall, men are paid more.
The main reason? There are more men in senior roles than women. In fact, in 82% of companies women are under-represented in high paying jobs when compared to the business as a whole.
Being the first study of its kind in the world, it was not without problems, and the figures are imperfect. For example:
- They did not measure or address the pay gap in similar roles;
- The quality of some of the data was patchy;
- It exempted people that are not technically employees, such as high-level executives, including equity partners, and non-employed workers.
Review of London Gender Inequality
Education Qualifications by Gender
In a previous post, we reviewed the gender split of London, which found that there are (or were at the time of the census) a relatively equal number of qualified men and women. Additionally, the census split the highest level of educational qualifications achieved into the following six groups:
- Level 1: 1-4 GCSEs or equivalent
- Level 2: 5 GCSEs or equivalent
- Level 3: 2 or more A levels or equivalent
- Level 4: Bachelor degree or equivalent, or higher
- Apprenticeships
- Other: Vocational/work-related qualifications, or foreign qualifications (level unknown)

It would be reasonable to assume that someone in senior management would be in the middle to later stages of their career. Subsequently, we would expect them to be at least in their 30s, although there are always exceptions.
If we were to split the workforce by generation, they would have been the following ages at the time of the census on 27 March 2011:

Therefore, we would estimate generation X and the baby boomers, both younger and older, are most likely at the stage of their career where they may hold a senior management position. As education is often used to determine if someone is capable of performing a role, are there differences in the qualifications held by each gender across generations?
Chart 2 below presents the generational split between level 4 qualifications. Level 4 represents the highest, and most challenging to attain, educational qualifications, and therefore should be the most susceptible to differences in opportunity. Furthermore, higher education is often a prerequisite for better paid professional positions, particularly those in the large companies surveyed in the gender pay gap study.

There is very little difference across all generations. In the ages most likely to hold senior management positions, Gen X and the younger and older baby boomers, the differences between the genders were 2.8%, 2.2% and 6.4% respectively. By comparison, the gap for Millennials was 7.2% in favour of women.
Although likely to now be retired, the relatively small (8.6%) gap between the men and women in the Silent generation adds support to the conclusion that supply of qualified women is not the issue. Or at least shouldn’t have been since the class of 1948 graduated.
But what level of qualifications do professionals and senior managers hold?
Qualifications of Managers and Professionals
Helpfully the census includes data on occupations and the levels of education held by people in those positions. The two occupational categories most relevant to the current study are:
- Managers, directors and senior officials (‘Managers’); and
- Professional occupations (‘Professionals’).
Chart 3 measures the proportion of Managers and Professionals to hold each level of educational qualification and contrasts them against the result for all London occupations.

Most noticeable is that the majority of professionals have completed higher education. Conversely, at 57%, the number of managers with a higher education qualification was closer to the 49% in all occupations than professionals.
The lower level of higher education, relative to professionals, may, at least in part, be due to the category containing managers, directors and senior officials of companies of all sizes. It includes directors of small limited companies along with those of FTSE listed companies. As the gender pay gap study consists of companies with 250 or more employees, it is the latter group that is more comparable to that study.
Overall, the gender split of people in professional occupations is relatively equal, which is in line with expectation since professional occupations have a more significant reliance on higher education qualifications, and these qualifications are held in roughly equal numbers by both genders.

Unfortunately, the same is not true for management positions. Despite the lower educational barrier, the gender split of management positions is disproportionately male and supports the findings of the gender pay gap study.

This difference between genders is an insightful finding, but only provides information on peoples’ professions and does not address the quality or amount of work. Unfortunately, data on the economic activity of each occupation by gender is not readily available in the census data. However, it can be helpful to look at the differences between the genders for London as a whole.
Workforce Participation by Gender
In reviewing the workforce participation of Londoners aged 16 to 64 (chart 6 below), there are three areas of visible difference between the genders:
- Women are far less likely to be in full-time employment (74% of men were in full-time jobs, while only 59% of women were).
- Almost twice as many women were in part-time employment.
- Women were 11 times more likely than men to be responsible for looking after the home or family.

Part of the problem may, therefore, be that women are far more likely to leave the workforce, either wholly or partially. Ideally, additional information would be available to help answer:
- How many of the men and women in part-time employment would take a full-time job if given the opportunity?
- Are highly qualified women more likely to be either inactive or in part-time employment than equally qualified men (one would believe this to be the case)?
- Are the qualifications held by Managers equally distributed for both genders, or are men more likely to keep management positions regardless of their educational qualifications?
In summary, the findings from the census data support that UK gender gap study: the job market is not fair for women.
Nevertheless, gender is only one differentiating trait of members of the workforce. Does someone’s ethnicity impact their chances of success in the London job market?
Review of London Ethnic Inequality
Education Qualifications by Ethnicity
Starting again with educational qualifications, the overall levels held by different ethnicities are similar (see chart 7 below), with a few notable exceptions:
- Black and mixed people are more likely to have GCSE and A-level qualifications (levels 1 to 3).
- Asian and white people are slightly more likely to have completed higher education (level 4).
- The most significant variance is in the ‘Other’ educational category, which is probably not too surprising given its broad nature (unknown levels of vocational/work-related qualifications, or foreign qualifications).
The ‘Other’ ethnic category comprises of Arab people, and any other ethnicities not covered by the other groups. A full breakdown of the different ethnic types is available here.

Ethnic Representation of Managers and Professionals
Following the approach used for gender differences, I will focus on management and professional occupations, and whether there are differences in the participation levels between ethnic groups. Due to the differences in the size of each ethnic group, proportional representation of managers and professionals in each ethnic group is used to present the results.
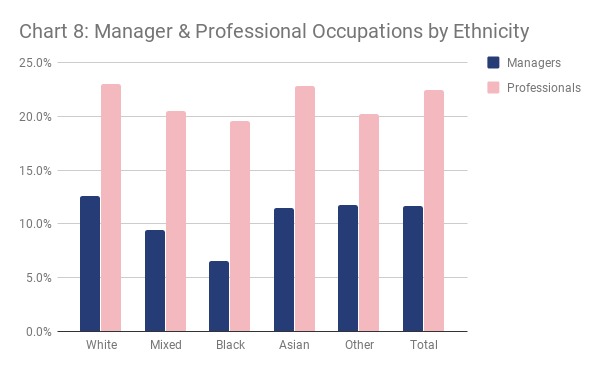
In some areas, the professional occupations data reflects the strong reliance on higher (level 4) education and the rates of those qualifications held by the different ethnic groups. For example:
- Asian and white people were more likely to have completed higher education, and these two groups also have the highest participation in professional occupations.
- Similarly, the other ethnicities have relatively even, both in their levels of higher education and in professional occupations.
Conversely, the results for Management positions show apparent disparities between ethnic groups, in particular:
- White people are 34% more likely to be in a management position than someone of mixed race;
- And 93% more likely than black people.
Given the broad range of qualifications of managers, the similar overall qualifications of all ethnic groups, and that white people are most likely not to hold any qualifications; there is no justification for the gaps.
So far we have looked at gender and ethnicity separately. What happens when considering gender and ethnicity together? Are the adverse effects compounded?
Ethnicity and Gender of Managers and Professionals
Looking deeper into the management occupation, chart 9 compares the levels of participation in management occupations by gender and ethnicity and includes a comparison against equal male and female participation as a yardstick (50/50).

The gender divide is alive and well across all ethnicities. While it is lowest among black people, any benefit black women may have enjoyed relative to their female peers is eroded by the overall disadvantage of merely being black. The other key points to note are:
- Women of the ‘Other’ ethnic category were almost as equally disadvantaged as black women, who were the group least likely to hold a managerial occupation.
- White women were the most likely female group to hold a managerial occupation.
- White and mixed race women were more likely to hold a managerial occupation than black men.
- Men of the ‘Other’ ethnic group were most likely of all groups to hold a managerial occupation and were almost twice as likely to hold such a position than black women, and 1.8 times more likely than women of the same ethnic group.
- White and Asian men were equally likely to hold a managerial position, meaning that the overall difference between white and Asian ethnic groups was due to the lack of Asian women in similar situations.
- Among white people, men are 77% more likely to hold a managerial position than women. As the majority of the London population identify as white (60%), this has a significant impact on the overall numbers in these positions.
These disparities make for some grim reading, and again, do not cover the quality of the work, or what it is paid. As before, it may help to review the split of workforce participation to see if it can offer any other trends.
Workforce Participation by Ethnicity
The various levels of economic activity also reveal differences between ethnic groups:
- Mixed and white people were significantly more likely to be in full-time employment.
- Black people were more likely to have someone looking after the family or home.
- Asian people had the highest proportion of their population studying and not working.

The unemployment rate shows further differences between the ethnic groups (chart 11 below). The percentage represents the portion of each population that are considered economically active but not in employment. Essentially people that would like to be working but were not. The unemployment rate in 2011, at the time of the census, was 8.9% for all of London, which is higher than the current level of unemployment.
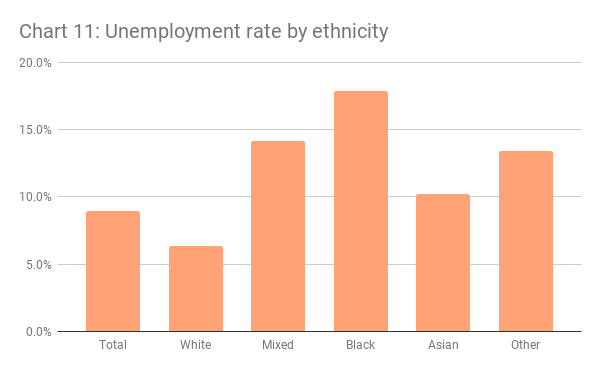
Most noticeably, white people were far less likely to be unemployed than any other ethnic group, which is somewhat surprising given that white people were also the most likely to hold no educational qualifications.
The next closest group were Asian people, who were still 60% more likely to be unemployed than white people. The disparity grows from there, as:
- People of mixed and ‘other’ ethnicities were just over twice as likely to be unemployed as white people.
- And black people were almost three times as likely to be unemployed than white people.
The London Job Market is Not Fair
Through conducting a rather straightforward analysis of educational qualification levels and workforce participation, the census data highlighted inequalities between genders and ethnicities in the London job market.
Ideally, further analysis will cover some of the issues in more depth, in particular, the quality of the work, what it is paid and any pay differences between people in the same role.